The number of undergraduate students and parents borrowing federal education loans has decreased for the second year in a row. Total new federal education loan dollars is down 9.6% from the peak in 2011-12. The decreases may be a sign of the economic recovery.
Data from the National Student Loan Data System (NSLDS) and the Common Origination and Disbursement (COD) system demonstrate that the number of undergraduate Direct Subsidized Loan borrowers decreased to 7.1 million in 2013-14 from 7.5 million in 2012-13, after peaking at 7.8 million in 2010-11 and 2011-12. The number of undergraduate Direct Unsubsidized Loan borrowers also decreased to 6.7 million in 2013-14 from 7.0 million in 2012-13, after peaking at 7.3 million in 2010-11 and 2011-12. Parent PLUS Loan borrowers decreased from 890,000 in 2010-11 to 870,000 in 2011-12, 710,000 in 2012-13 and 700,000 in 2013-14.
| Direct Subsidized Loans |
Direct Unsubsidized Loans | |||
|---|---|---|---|---|
| Undergraduate Year |
Number of Recipients | Dollars Disbursed | Number of Recipients | Dollars Disbursed |
| 2010-2011 | 7,781,239 | $28,944,705,193 | 7,328,892 | $30,688,797,732 |
| 2011-2012 | 7,843,575 | $28,973,143,466 | 7,341,322 | $30,492,581,932 |
| 2012-2013 | 7,524,261 | $27,812,884,986 | 7,044,213 | $29,553,610,865 |
| 2013-2014 | 7,104,551 | $25,622,429,595 | 6,681,966 | $27,010,349,262 |
The number of graduate Direct Unsubsidized Loan borrowers remained flat at about 1.5 million borrowers and the number of Grad PLUS Loan borrowers remained around 350,000 borrowers.
The decrease in federal loan volume appears to be mostly driven by the decrease in the number of borrowers, as average loan amounts remained relatively stable. The average undergraduate Direct Subsidized Loan dropped to $3,600 in 2013-14 from $3,700 in 2010-11 through 2012-13. Likewise, the average undergraduate Direct Unsubsidized Loan dropped to $4,000 in 2013-14 from $4,200 in 2010-11 through 2012-13. The average Parent PLUS Loan, however, increased from $11,900 in 2010-11 to $14,500 in 2013-14 and the average Grad PLUS Loan increased from $20,000 to $21,600 during this same period.
| Year | Average Direct Subsidized Loan | Average Direct Unsubsidized Loan |
|---|---|---|
| 2010-2011 | $3,720 | $4,187 |
| 2011-2012 | $3,694 | $4,154 |
| 2012-2013 | $3,696 | $4,195 |
| 2013-2014 | $3,606 | $4,042 |
| Parent PLUS Loan |
|||
|---|---|---|---|
| Year | Number of Recipients | Dollars Disbursed | Average Loan |
| 2010-2011 | 888,416 | $10,591,442,356 | $11,922 |
| 2011-2012 | 869,307 | $11,076,472,408 | $12,742 |
| 2012-2013 | 705,992 | $9,837,435,661 | $13,934 |
| 2013-2014 | 701,835 | $10,153,885,150 | $14,468 |
| Grad PLUS Loan |
|||
|---|---|---|---|
| Year | Number of Recipients | Dollars Disbursed | Average Loan |
| 2010-2011 | 347,767 | $6,959,275,871 | $20,011 |
| 2011-2012 | 355,358 | $7,479,408,838 | $21,048 |
| 2012-2013 | 346,846 | $7,611,633,133 | $21,945 |
| 2013-2014 | 350,945 | $7,577,166,813 | $21,591 |
Overall federal estudent loan disbursements decreased from $105 billion in 2010-11 and $106 billion in 2011-12 to $102 billion in 2012-13 (4.0% decrease) and $96 billion in 2013-14 (5.8% decrease).
The following table is limited to new Direct Subsidized and Unsubsidized Loans, new Grad PLUS Loans, and new Parent PLUS Loans. It does not include Perkins Loans, Direct Consolidation Loans, or private student loans.
| Year | Total Undergraduate Direct Loan Volume | Total New Federal Student Loan Volume |
|---|---|---|
| 2010-2011 | $59,633,502,925 | $105,343,518,023 |
| 2011-2012 | $59,465,725,398 | $106,087,859,438 |
| 2012-2013 | $57,366,495,851 | $101,821,767,896 |
| 2013-2014 | $52,632,778,857 | $95,892,126,803 |
College enrollments increase during economic downturns due to a countercyclical effect, where unemployed individuals return to college to acquire credentials to make themselves more marketable in a tight job market. There were also increases in the number of middle- and high-income students applying for financial aid due to stock market losses, declines in the value of college savings plans and increases in unemployment.
These trends reverse during an economic recovery, resulting in a decrease in the demand for student loan debt.
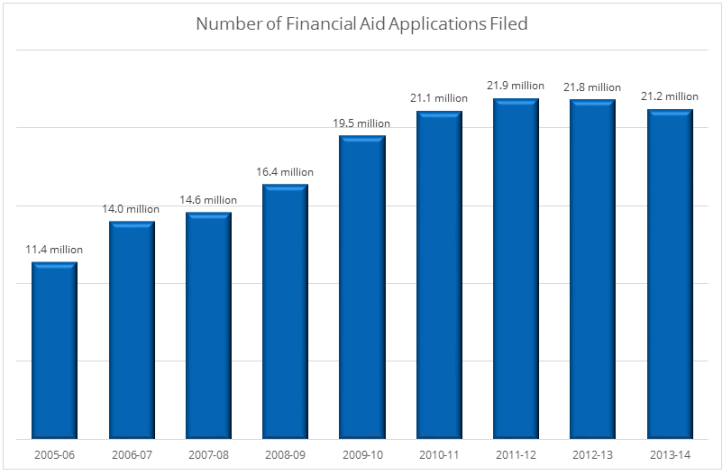
For example, the number of applicants for federal student aid increased dramatically from 14.6 million in 2007-08 to 21.1 million in 2010-11 and 21.9 million in 2011-12, then decreased slightly to 21.8 million in 2012-13 and 21.2 million in 2013-14.
Federal student loan volume is unlikely to continue to decrease for more than another year or two. After the economic recovery is complete, student loan volume will increase because college costs continue to increase and grants are failing to keep pace with increases in college costs. Declines in federal and state support of postsecondary education on a per-student, constant dollar basis will continue to shift the burden of paying for college from the government to students and their families. Family income and savings do not increase enough to cover the added cost. This forces students to shift their enrollment to lower-cost colleges and to increase their debt at graduation. Even as the number of borrowers decreases for the next few years, the average debt at graduation among those who borrow will also continue to increase.


